
Thermal stress analysis

Make mechanical tensions visible — contactless and through imaging.

Thermal stress analysis makes it possible to visualize stress distributions in components under dynamic load — non-destructively, precisely and synchronously with mechanical stress.
Thermische Spannungsanalyse Funktionsweise

How it works - explained in a nutshell

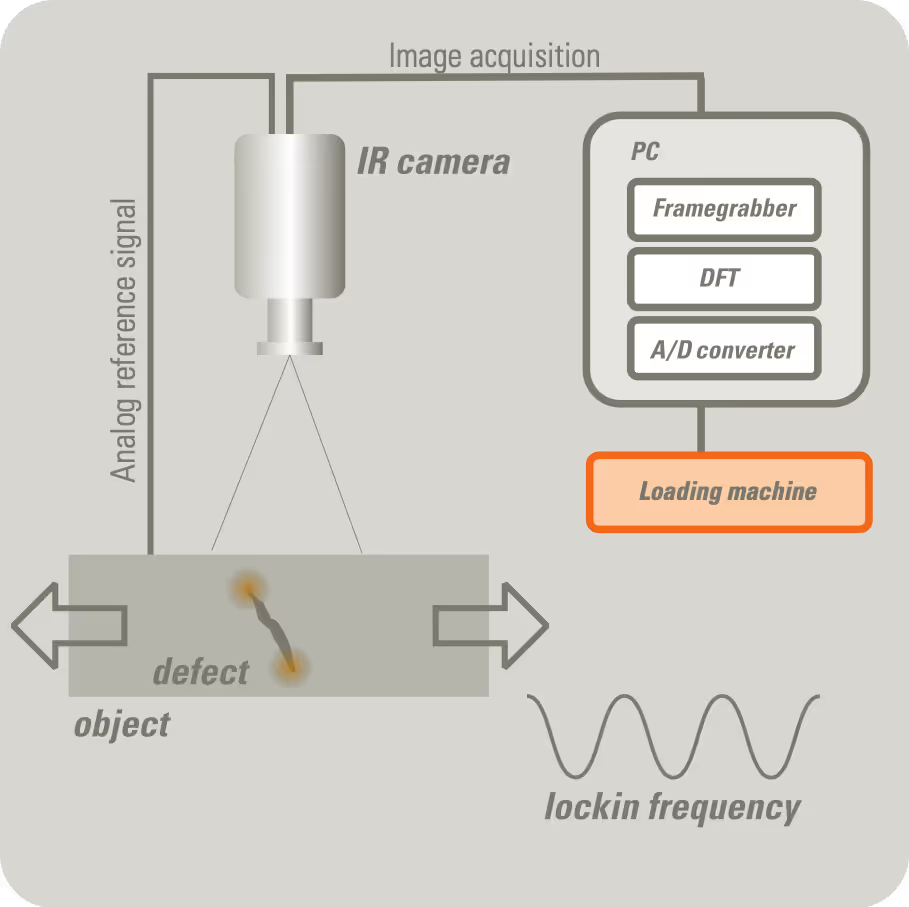
Thermal stress analysis utilizes the thermoelastic effect: under cyclic mechanical loading, minimal temperature changes occur within the material. These are captured using high-resolution infrared cameras and enable real-time visualization of stress distributions and crack propagation. The method is non-contact, non-destructive, and can be precisely synchronized with mechanical test rigs.

Why Thermal Stress Analysis?

Thermal Stress Analysis (TSA) enables the visualization of stress distributions in components under dynamic loading. It is used to validate simulations, detect crack formation, and understand the failure behavior of materials.

Typical Applications:

  • Detection of residual stresses after manufacturing processes (e.g., welding, forming)
  • Investigation of components under load
  • Validation of FEM simulation
  • Quality control of materials with anisotropic behavior
  • Research & development of new materials or composites

Thermographic Solution

TSA is based on detecting minimal temperature changes caused by mechanical stresses within the material.

Using lock-in thermography, these changes are precisely detected and visualized. Under cyclic loading of a component, elastic deformations lead to minimal temperature changes (thermoelastic effect). These are captured by a synchronized infrared camera. The resulting data enables the visualization of stress distributions and the identification of crack formation or material fatigue.

Dehnungsmessstreifen oder Thermografie?

Dehnungsmessstreifen sind das Standardwerkzeug, wenn Spannungen am realen Bauteil gemessen werden: Jeder Streifen wird aufgeklebt, verkabelt und liefert die Dehnung an genau einem Punkt. Wo die höchste Spannung auftritt, muss vorher bekannt sein. Die thermische Spannungsanalyse von edevis ist die bildgebende Alternative zu Dehnungsmessstreifen: Unter zyklischer Last ändert sich die Temperatur des Materials mit jedem Lastwechsel minimal, der thermoelastische Effekt. Eine synchronisierte Infrarotkamera erfasst diese Änderungen und macht daraus ein vollflächiges Spannungsbild des ganzen Bauteils, berührungslos und ohne Applikation. Spannungsspitzen, Kerbwirkungen und beginnende Risse werden dort sichtbar, wo sie entstehen. Typisch für Prüfstandsversuche, FEM-Validierung und Ermüdungsuntersuchungen.

Kriterium
Dehnungsmessstreifen
Thermografie (edevis)
Messung
Dehnungsmessstreifen
ein Punkt je Streifen
Thermografie (edevis)
vollflächig, jedes Pixel ein Messpunkt
Applikation
Dehnungsmessstreifen
kleben, verkabeln, je Messstelle
Thermografie (edevis)
keine, berührungslos
Spannungsspitzen
Dehnungsmessstreifen
müssen vorher bekannt sein
Thermografie (edevis)
werden im Bild gefunden
Belastung
Dehnungsmessstreifen
statisch und zyklisch
Thermografie (edevis)
zyklisch, am Prüfstand
Ergebnis
Dehnungsmessstreifen
Messwert je Kanal
Thermografie (edevis)
Spannungsbild, direkt mit der FEM vergleichbar

Ersetzt die thermische Spannungsanalyse den Dehnungsmessstreifen?

Im Prüfstandsversuch mit zyklischer Last häufig ja, weil sie das ganze Bauteil auf einmal erfasst und Spannungsspitzen ohne Vorwissen findet. Für statische Lasten und die absolute Messung an definierten Punkten bleibt der Dehnungsmessstreifen gesetzt. Oft ergänzen sich beide: Die Thermografie zeigt, wo es kritisch wird, der Streifen liefert dort den Absolutwert.

Was zeigt das thermische Spannungsbild?

Die Verteilung der mechanischen Spannung unter Last: Kerbwirkungen, Lastpfade, Einflüsse von Eigenspannungen und beginnende Risse, die sich als lokale Spannungsspitze verraten. Die Auswertung erfolgt mit DisplayImg TSAvis in Echtzeit, synchron zum Prüfstand.

Software Solution for Thermal Stress Analysis

For the efficient implementation of thermal stress analysis, the software solution DisplayImg TSAvis offers a powerful platform. It enables precise measurement and evaluation of stresses and dissipation in real time – ideal for research, development, and quality assurance.

Discover our testing laboratory

Whether feasibility studies, series tests or individual part analyses

Learn more

Unsure whether thermal stress analysis can help?

In a brief initial consultation, we clarify how thermography can effectively support you – clear, transparent, and without obligation.

FAQ

Our frequently asked questions — answered quickly and easily.

All questions/answers

For which materials is thermography suitable?

How is synchronization with mechanical test stands implemented?

How sensitive is TSA to temperature changes?

Is the method suitable for inline integration into production processes?

Which materials can be investigated using TSA?